UrjaLogic
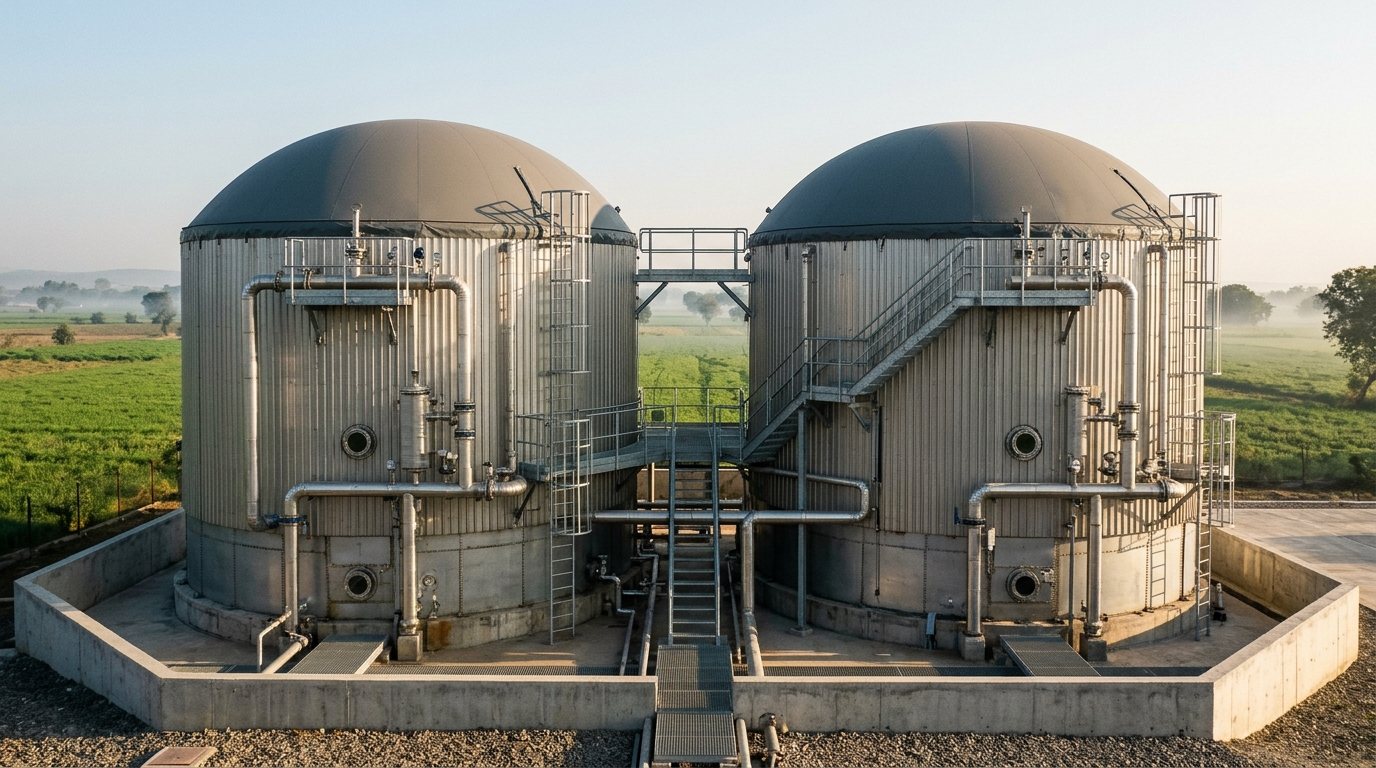
Insulated cylindrical anaerobic digester tanks with double-membrane biogas domes and stainless recirculation manifolds at an Indian CBG facility

Anaerobic Digestion

How anaerobic digesters work, and why they reward digital twinning.

An anaerobic digester is a living four-stage biological reactor with a multi-day memory. Understanding how its eight coupled variables interact shows why adding 24/7 digital twinning unlocks 6-15% higher metered gas output.

Schematic 01 · Physical Digester Layout

Inside a Wet Anaerobic Digester (Cross-Section & Standard Plant Sensors)

Standard Meter / PLC Signal (Already on Site) Hidden Zone Inside the Tank
BIOGAS HEADSPACE (DOME) 55-62% CH₄ · 38-44% CO₂ · H₂S · Moisture SURFACE CRUST & FOAMING ZONE (Floating Straw / Trapped Gas) ACTIVE DIGESTION ZONE (37-40°C · 8-12% Solids) 4-stage bacteria & archaea · Hidden acid, alkalinity & ammonia balance HEATING COIL (<0.5°C/day swing) SETTLED SAND & SILT LAYER (Shrinks Working Tank Volume) Weighed Biomass Feed Straw · Press Mud · Dung Weighbridge + Moisture To Scrubber & Upgrader Metered CBG (>96% CH₄) Solid-Liquid Separator FOM Manure + Liquid LFOM LIQUID RECIRCULATION (Recovers Heat & Alkalinity) Gas Flow · CH₄% Dome Press · Lvl Mixer Power kW Tank Temp °C LAB: pH · FOS/TAC (2×/wk)

01 · The Process Inside the Dome

Four microbial stages working in line, at very different speeds.

Inside an oxygen-free tank, crop residue and press mud cannot turn straight into biomethane. Four groups of microbes pass material from one stage to the next, and the whole digester is only as stable as its slowest, most sensitive stage.

STAGE 01 →

Hydrolysis

Raw Plant Fibers → Simple Sugars & Amino Acids

Natural enzymes break tough fibers, starches, proteins, and fats in paddy straw, Napier grass, and press mud into dissolved nutrients. Poor shredding, wrong moisture, or tough woody stalks slow gas output right at the start.

Bottleneck on fibrous straw (days)

STAGE 02 →

Acidogenesis

Dissolved Nutrients → Volatile Acids (VFAs), CO₂ & H₂

Fast-multiplying acid bacteria rapidly turn dissolved sugars into organic acids (propionate, butyrate, acetate), alcohols, hydrogen, and carbon dioxide. Whenever feed jumps too fast, this stage surges within hours.

Very fast growth (3-12 hours)

STAGE 03 →

Acetogenesis

Heavier Volatile Acids → Acetate, H₂ & CO₂

Helper bacteria convert heavier propionic and butyric acids into acetate and hydrogen, the direct food for methane microbes. If dissolved hydrogen backs up or heavy mixing breaks bacterial clusters, propionate builds up quickly.

Moderate & sensitive (1-4 days)

STAGE 04 CH₄ Output

Methanogenesis

Acetate & H₂/CO₂ → Methane (CH₄) Biogas

Specialized methane-producing microbes generate every cubic meter of sellable gas. They multiply 5 to 10 times slower than acid bacteria and are easily set back by temperature swings, rising acids, ammonia, or H₂S.

Slow & delicate microbes (4-15 days)

Schematic 02 · Biological Conversion Steps

How Raw Biomass Turns Into Methane (and Where Upsets Begin)

~70% CH₄ from Acetate · ~30% CH₄ from H₂ + CO₂
RAW FEED 1 · HYDROLYSIS 2 · ACIDOGENESIS 3 · ACETOGENESIS 4 · METHANOGENESIS Raw Plant Fibers Cellulose · Starches Proteins · Fats 100% Volatile Solids Dissolved Nutrients Simple Sugars Amino & Fatty Acids Straw Bottleneck Volatile Acids (VFA) Propionate · Butyrate Alcohols · Acetate Dissolved H₂ + CO₂ FAST (3-12h growth) Spikes on heavy feed Acetate ~70% of Methane Slows if H₂ backs up Hydrogen + CO₂ ~30% of Methane Secondary CH₄ path Methane (CH₄) Gas Methane-forming microorganisms SLOW (4-15d growth) Sensitive to acids, temp swings & NH₃ Acid-Producing Bacteria: Multiply in Hours (Fast Acid Buildup) Methane Producers: Multiply in Days to Weeks (Fragile)

Schematic 03 · Why Upsets Catch Teams Off Guard

Fast Acid Bacteria vs. “The pH Trap”

Stage 2 acid-producing bacteria multiply in hours, while Stage 4 methane-producing microbes take days to weeks. When feedstock moisture changes or feeding rises slightly too fast, Volatile Fatty Acids (VFAs) climb right away.

Yet digester pH stays flat near 7.1 for days because natural alkalinity buffers the rising acid. Once that buffer runs out, pH and gas output drop sharply together, costing two to three weeks of recovery.

How an Unspotted Souring Event Develops Over 10 Days Hidden VFA rise vs. Apparent pH
DIGITAL TWIN EARLY ACTION WINDOW (DAYS 2-6) BUFFER EXHAUSTED ("pH DROP") Tank pH (looks steady at 7.1 until Day 6) Hidden VFA / FOS-TAC Ratio (rising unseen) Day 0 (Feed shift) Day 4 Day 6 Day 10 (14-21d loss)

02 · What Impacts How

Eight connected factors govern every cubic meter of biogas.

High digester yield is never about pushing one dial to the maximum. Every operating factor interacts with the others across a multi-day biological lag.

Schematic 04 · Safe Operating Windows

Why Digester Output Peaks Inside Narrow Sweet Spots

Green = Peak Zone · Terracotta = Drop-Off / Upset Risk

A · Temperature Window

Sharp drop-off above 41°C or on daily temperature swings

37-40°C Heat stress 25°C 33°C 38°C 44°C

B · Carbon-to-Nitrogen (C:N) Mix

Balancing nitrogen-rich press mud/dung with high-carbon straw

High Ammonia 20:1-30:1 Slow fiber digestion 10:1 20:1 30:1 60:1

C · Daily Organic Loading (OLR)

Why cautious plants under-feed and sudden jumps cause upsets

Unused capacity SAFE PEAK Souring drop 1.5 2.8 4.0 5.5 kgVS/m³
FACTOR 01 Tank Solids: 8-12% · Track VS% per lot

Feedstock Quality, Moisture & Digestible Solids (TS/VS)

Methane comes only from digestible Volatile Solids (VS), not gross truck weight. Rain-soaked straw or aged press-mud clamps change moisture and VS% every week. Feeding fixed tonnage quietly over- or under-feeds the biology, while field sand and ash settle at the bottom and shrink working tank volume.

How the Digital Twin Helps Your Team

Adjusts daily feed weights for each lot’s moisture, VS%, and storage age so actual biological food stays steady.

FACTOR 02 Target C:N: 20:1 to 30:1 · Watch Free NH₃

Carbon-to-Nitrogen (C:N) Balance & Ammonia

Microbes need carbon for energy and nitrogen to grow. Pure paddy straw (C:N 60:1 to 80:1) runs short of nitrogen and digests slowly. On the other hand, too much press mud, poultry litter, or protein waste (C:N below 15:1) builds Free Ammonia, stalling methane microbes even while pH looks healthy.

How the Digital Twin Helps Your Team

Calculates daily blends across stockyard lots so C:N and ammonia stay in the peak gas-producing zone.

FACTOR 03 OLR: 2.5-4.5 kg VS/m³/day · HRT: 25-45 days

Daily Organic Loading (OLR) & Retention Time (HRT)

OLR measures how much digestible food enters each cubic meter per day; HRT measures how many days slurry stays in the tank. Sudden jumps in feed overload slow methane microbes and spike acids, while adding too much water shortens HRT and washes active microbes out with the digestate.

How the Digital Twin Helps Your Team

Guides safe, step-by-step load increases and tracks true retention time including liquid recirculation.

FACTOR 04 Mesophilic: 37-40°C · Swing < 0.5°C / day

Temperature Stability (Daily Swings Hurt Most)

Methane microbes handle a steady 37°C far better than bouncing between 36°C and 39°C. A 1.5°C dip from cold winter feed slurry or a fouled heat exchanger cuts methane output by 15-25% overnight while acid bacteria keep producing VFAs, quickly tipping the tank toward souring.

How the Digital Twin Helps Your Team

Links feed pulses, ambient weather, and heating performance to catch thermal drift before biology suffers.

FACTOR 05 Safe FOS/TAC: 0.20-0.35 · Warning > 0.40

Acid-to-Alkalinity Ratio (FOS/TAC) vs. pH

Natural bicarbonate alkalinity works like a shock absorber, holding pH near 7.1 even while Volatile Fatty Acids double inside the digester. Watching pH alone misleads teams: once alkalinity runs out, pH drops below 6.6, foam rises into gas lines, CH₄% falls, and recovery takes 2 to 3 weeks.

How the Digital Twin Helps Your Team

Tracks estimated VFA and buffer health continuously between twice-weekly lab checks.

FACTOR 06 Even heat & nutrient contact · Timed cycles

Mixing, Crust Formation & Agitator Power

Light straw fibers tend to float while sand sinks. Too little mixing lets thick surface crusts form, trapping gas until sudden foam eruptions occur and creating dead zones. Yet running mixers nonstop at high speed wastes electricity and breaks apart delicate microbial clusters.

How the Digital Twin Helps Your Team

Uses mixer motor current trends and solids percentage to time mixing cycles and spot crust buildup early.

FACTOR 07 Keep dissolved sulfide low · Maintain Co, Ni, Fe, Se

Hydrogen Sulfide (H₂S) & Trace Nutrients

High-sulfur inputs generate H₂S gas, which stresses methane microbes inside the tank and saturates scrubbers downstream. At the same time, single-crop farm residues often lack tiny amounts of Cobalt, Nickel, and Selenium that methane enzymes need, quietly capping gas yield 15-25% below potential.

How the Digital Twin Helps Your Team

Helps your chemist distinguish nutrient deficiency or H₂S stress from mechanical or heating issues.

FACTOR 08 3 to 14 day lag between feed & full gas response

Multi-Day Biological Memory & Combined Effects

None of these factors act alone. Higher temperature makes ammonia twice as toxic; wet monsoon bales hide a drop in actual solids fed; Tuesday’s heavy press-mud batch interacts with Friday’s recirculation rate. Tracking eight moving parts across a multi-day lag is where digital tools shine.

How the Digital Twin Helps Your Team

Keeps a continuous memory of past batches, lab tests, and temperatures so every daily recommendation fits current tank state.

03 · Operational Reality

Why manual oversight alone leaves 15-25% of plant potential uncaptured.

Most CBG plants rely on dedicated site teams and manual checks. Even with strong discipline, three structural realities of anaerobic digestion make continuous digital modeling necessary for peak performance.

01 / 24/7 CONTINUITY

Nobody can stand beside the digester across every shift

Plants run 24 hours a day across rotating shifts, weekends, and staff changes. Subtle drift in mixer current, heating loops, or gas composition at 2:00 AM is easy to miss during morning shift handovers, especially as groups scale to multiple sites.

02 / SEALED TANK BLIND SPOTS

Twice-weekly lab tests leave 3 to 4 day gaps

Standard PLC screens show temperature, pressure, and gas flow, not internal acid buildup. Even when a diligent lab chemist runs FOS/TAC and TS/VS twice a week, monsoon moisture or a heavy press-mud lot can push acids up for four days unseen.

03 / CAUTIOUS UNDER-FEEDING

Protecting against crashes leaves 15-25% capacity unused

Because one souring incident costs ₹18-30 lakh and weeks of recovery, sensible plant heads play it safe and feed well below peak capacity. Without live buffer tracking and daily blend math, plants leave lakhs of monthly gas revenue on the table.

04 · The Case for Digital Twinning & Metered Worth

Clear guidance for your operators. Undeniable proof on your meters.

In a CBG plant, you never have to guess whether software is paying off. Every truckload of biomass is weighed, every cubic meter of gas is metered, and every unit of power is billed, so every percentage point of efficiency shows up directly in rupees.

Schematic 05 · Digital Twin + Operator Co-Pilot

How Existing Plant Records Turn Into 24/7 Digester Guidance & Verifiable Gains

Software-First · Operators Stay in Command
01 · WEIGHED & METERED ON SITE Weighbridge & Stockyard Tons fed · Lot moisture · ₹/MT cost Existing PLC & Meters Temp · Gas flow · CH₄% · Power kWh Lab Checks (2-3× per week) pH · FOS/TAC · TS/VS · COD Anchors live tank estimates 02 · URJALOGIC DIGITAL TWIN Digester Mass & Biology Model Tracks 4-stage digestion, C:N & buffer balance 24/7 Health & Early Risk Tracker Estimates live VFA buildup between lab tests Daily Feed Mix & Cost Calculator Finds highest-profit daily blend within safe load 03 · TEAM CO-PILOT & METERED ROI 3-7 Day Early Warnings Hold feed or run lab check before upset Daily Feed Blend Guidance Exact tons per lot for lowest ₹/kg CBG Proven on Your Own Meters Visible in kg/ton yield & kWh/kg power
Operational Area Manual Oversight & Raw SCADA Alone With UrjaLogic Digital Twin & Analytics
Daily Decision Flow Depends on manual logs, periodic spot checks, and reactive adjustments once symptoms appear. Continuous 24/7 digital monitoring across every shift, surfacing clear actions days before output drops.
Visibility Between Lab Tests 72 to 96 hour blind windows between twice-weekly manual FOS/TAC and TS/VS lab sheets. Continuous live tracking of estimated acid buildup and buffer margin using existing PLC and lab records.
Preventing Souring & Foaming Often caught only after CH₄% dips, foam enters gas lines, or pH starts falling. 3 to 7 day early warnings with clear prompts to hold feed or run one targeted lab check.
Daily Multi-Feedstock Blend Fixed tonnage habits that miss weekly swings in moisture, clamp age, and C:N balance. Daily blend calculator maximizing metered gas per rupee while keeping digester load safe.
Digester Capacity Used Run cautiously at 60-75% of design load because a single biological crash costs ₹18-30L. Clear safety margins help operators step up steadily toward 85-95% nameplate output.
Measuring Product Worth (ROI) Hard to separate feedstock quality changes from process losses at month-end. Directly visible on your weighbridge, gas flowmeters, kWh meters, and daily ₹/kg cost.

How You Measure the Worth of UrjaLogic

Four plant numbers that prove payback in black and white

01 / YIELD

kg CBG per Ton Fed

Verified directly from gate weighbridge slips vs. billed CBG dispatch (+6 to 15% uplift).

02 / UPTIME

Zero Souring Shutdowns

Preventing even a single 14 to 21 day digester upset protects ₹18 to 30 lakh in gas sales.

03 / RECOVERY

Raw Gas to CBG Ratio

Comparing digester gas meters to cascade fills catches 2-5% silent methane slip in upgraders.

04 / POWER

kWh per kg CBG

Sub-meter tracking across mixers and compressors cuts auxiliary electricity bills by 5-12%.

See It Applied Across the Full CBG Plant

Explore our live CBG plant screen, or request a Closed Beta invite for your digesters.

Engineered by Goljyu Innovations Private Limited · Onboarding select Indian CBG facilities by invite.